tSNEJS is an implementation of t-SNE machine learning algorithm for visualization. Check out the forked repo https://github.com/karpathy/tsnejs. The main project website also has a live example and more description.
t-SNE is a visualization algorithm that embeds high-dimensional data for visualization in a low-dimensional space of two or three dimensions. Specifically, it models each high-dimensional object by a two- or three-dimensional point in such a way that similar objects are modeled by nearby points and dissimilar objects are modeled by distant points with high probability. If you have some data and you can measure their pairwise differences, t-SNE visualization can help you identify clusters in your data.
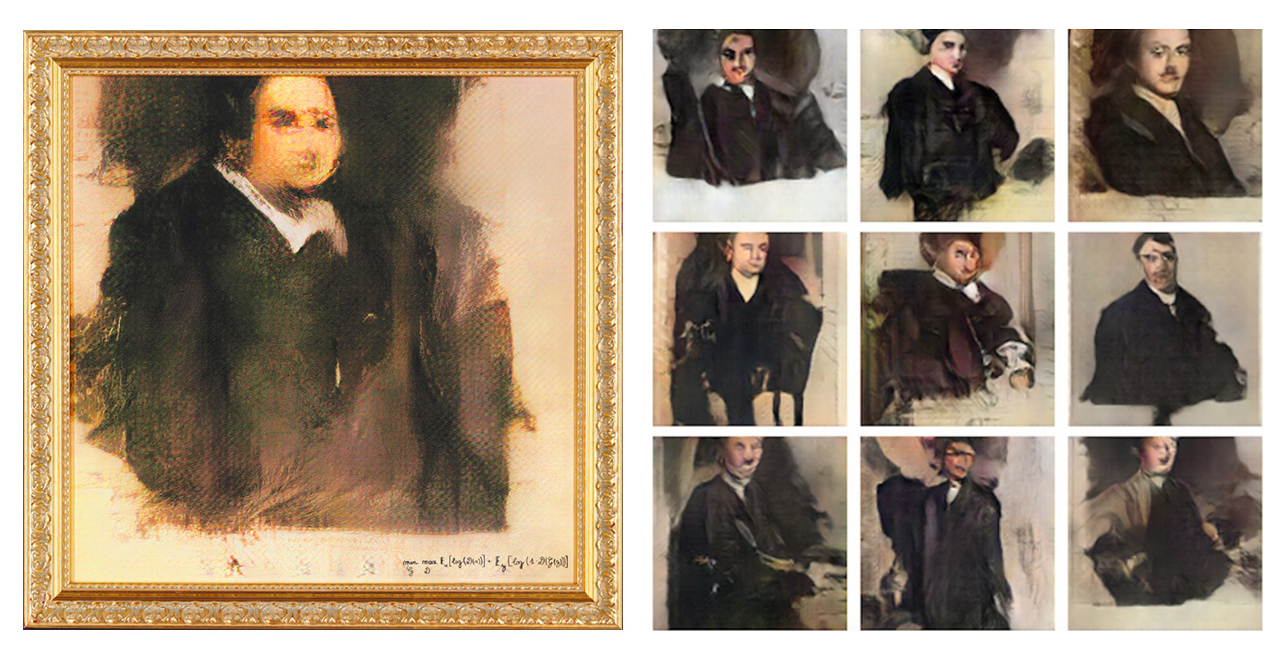
Deep Convolutional Generative Adversarial Networks (GANs) is a class of unsupervised machine learning framework where two models are trained simultaneously by an adversarial process. A generator (“the artist”) learns to create images that look real, while a discriminator (“the art critic”) learns to tell real images apart from fakes. I used one of the implementations of DCGAN to generate the images for this project.
In this project I used the images from the result of train process of DCGAN machine learning algorithm and the discriminator and generator loss values as the 2 dimensional data points from 100 epocs to be able to see the similarities between the images generated over time. In a sense, I intent to use tSNE visualization to be able to get more involved in the learning process of an algorithm in an interactive way.